The real difference between infrastructure and real estate

It’s increasingly well-recognised that real assets are strategically important for an investment portfolio. These assets provide diversification to a traditional equities/bonds allocation. Through their exposure to hard assets, they can adapt to changing economic regimes and have differentiated levers to support performance over time. Under the real assets umbrella, global listed infrastructure (GLI) offers the key investment characteristics of structural growth, inflation protection and defensive cash flow generation underpinned by the provision of essential services. These fundamental drivers are why GLI is a staple within a resilient and long-term-oriented portfolio.
Many investors have long considered property to be the core part of a real asset allocation while overlooking GLI. We think this framing misses the attractive characteristics an allocation to GLI can provide. These asset classes are distinct and are not direct substitutes. In this report we explore some of the key benefits of GLI versus a property exposure.
The ‘real’ opportunity
In portfolio allocations, listed infrastructure is often grouped with listed property. Given both are considered real assets offering yield and growth, this is a natural way to think. Furthermore, both asset classes provide predictable cash flows – supported by long-duration assets that earn economic rent – with a degree of inflation protection relative to general equities. They are also considered diversifiers, reflecting their lower correlation to equities. As a result, infrastructure and real estate provide some of the same characteristics to an investor.
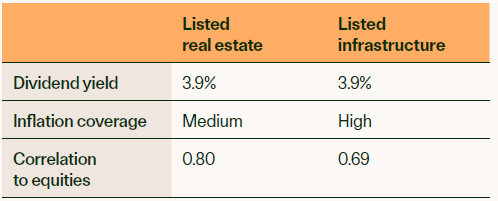
Source: Bloomberg, Global Listed Infrastructure Organization (GLIO), Magellan, June 2026. Listed infrastructure refers to the MFG Core Infrastructure Strategy. FTSE/ EPRA NAREIT Developed Total Return Index (in USD). Data since the inception of the MFG Core Infrastructure Strategy (January 2012) to 30 June 2026. Equities refers to the MSCI World Index.
…and real points of difference
When viewed alongside general equities, the commonalities across the real asset classes are apparent. This overview of common characteristics also highlights some important points of difference between listed infrastructure and listed real estate.
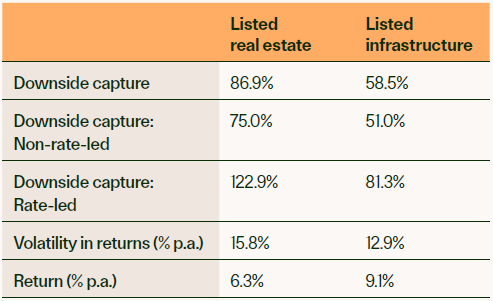
Source: Bloomberg, Magellan, August 2026. Listed infrastructure refers to the MFG Core Infrastructure Strategy, net of fees and in USD. Listed real estate refers to the FTSE/EPRA NAREIT Developed Total Return Index (in USD). Data since the inception of the MFG Core Infrastructure Strategy (January 2012) to 30 June 2026. Downside capture is calculated as average drawdown for the asset class as compared to general equities, for each drawdown event over this period. A market drawdown event is defined as where general equities decline by 5% or more.
We can see that, historically1, listed infrastructure has recorded lower average downside capture than listed real estate, indicating the ability of the asset class to absorb major shocks such as the current energy market shock, along with rate cycles and changing economic conditions. It is notable that across both rate-led, and non-rate-led drawdowns, infrastructure captures less of the market drawdown than does real estate or equities. This is significant, given infrastructure assets are typically of longer duration than real estate. This underscores the role of listed infrastructure as a genuinely defensive allocation. At the same time, the relatively high downside capture for real estate shows its cyclicality and also rate sensitivity.
Accordingly, it is also important to observe that the two asset classes have different risk and return profiles. This is clear in the chart below, which shows risk/return profiles for 2012-2026 YTD. Listed infrastructure has delivered lower volatility in returns (a significantly lower standard deviation of ~12.9% vs 15.8-17.1% for listed property2). At the same time, listed infrastructure has recorded higher average annual returns than for listed property (9.1% for infrastructure vs 6.3%-8.0% for property3).
Listed infrastructure offers distinct risk-return characteristics compared to listed property
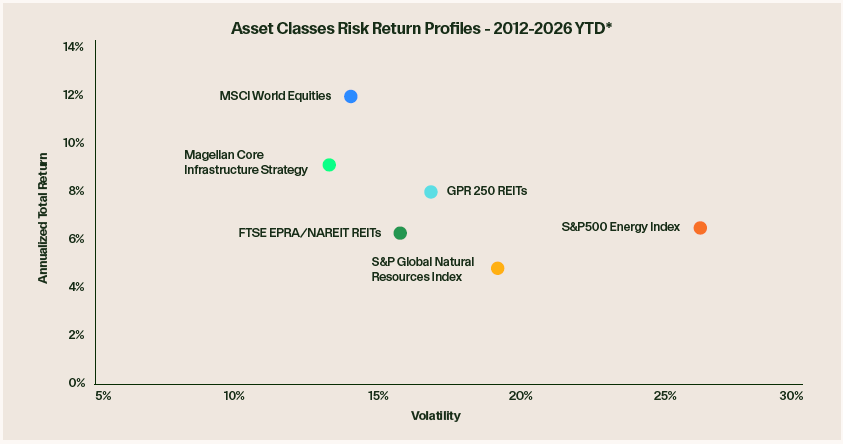
Source: Bloomberg, Magellan, August 2026. Data since the inception of the MFG Core Infrastructure Strategy (January 2012) to 30 June 2026.
While listed infrastructure and listed real estate share certain characteristics, such as regular cash flows and a degree of inflation protection, their performance often diverges in different market conditions.
The 12-month period from July 2025 to June 2026 is a useful case study on how these two real asset classes perform differently. This period was initially one of steady economic conditions and easing interest rate headwinds, which are supportive for long-duration, real assets. Market uncertainty on the implications of AI also drove a rotation into these sectors, with listed infrastructure and real estate moving in tandem. With the energy market shock from the end of February 2026, as the Iran War broke out, performance between the two asset classes diverged. Global listed infrastructure has demonstrated resilience, while listed real estate drew down. The gap in performance highlights the importance of GLI in a portfolio, with this period showing that, in times of market stress, infrastructure performs differently from general equities and pro-cyclical real estate businesses. This underscores the important role of GLI as a diversifier in an investor’s portfolio.
Infrastructure behaves differently from listed property in times of market stress
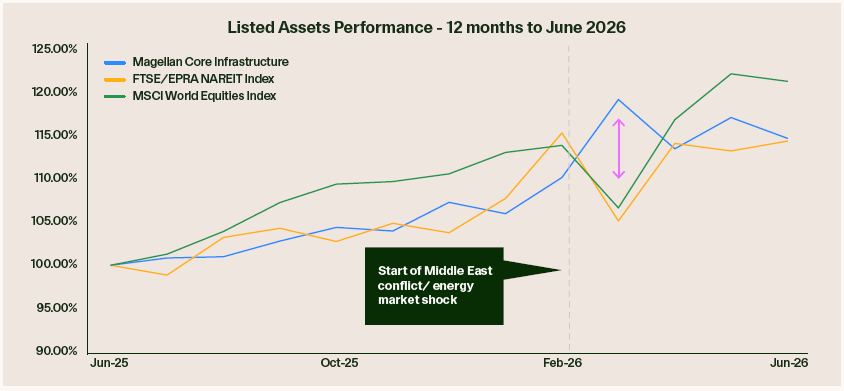
Source: Magellan, Bloomberg, August 2026.
The real difference is underpinned by fundamentals
These key differences in performance reflect the underlying fundamentals of these two asset classes. Infrastructure assets are typically monopolies delivering essential services (such as water, electricity and roads). They are more often than not regulated/contracted to protect consumers, given the low elasticity of demand. The demand for these assets, and the associated cash flows to investors, show very little variation through an economic cycle. For example, we can observe that, historically, high-quality US regulated utilities have delivered predictable financial results regardless of economic conditions, with their achieved return on equity holding in the range of 9%-11% over the last 20 years.
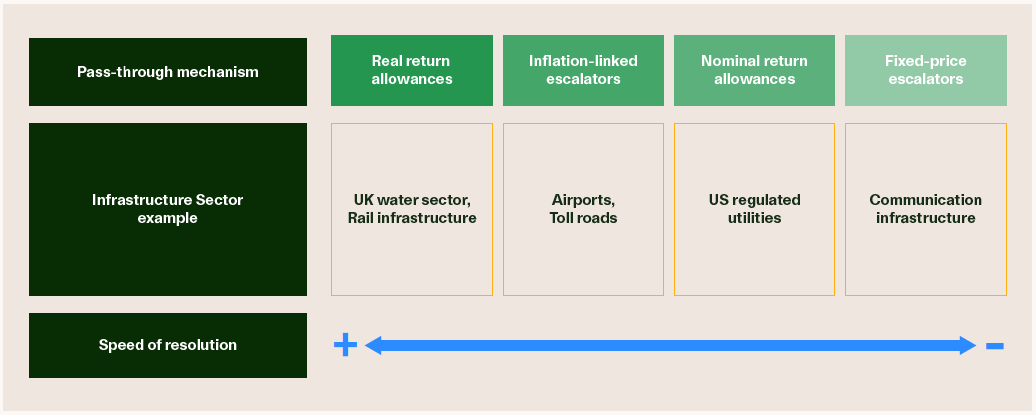
Many of these businesses have inflation pass-through mechanisms in place. These differ from asset to asset but in general do provide the ability for companies to pass on costs or catch up the impact (albeit with a lag, the duration of which depends on the asset). For example, some assets, such as UK water utilities, have real return allowances, which offer rapid recovery of inflation impacts. Many roads have inflation-linked escalators built into their concession contracts that provide this explicit protection while airports have a mix of regulated returns and inflation‑protected contracts. US regulated utilities have nominal return allowances, with the inbuilt ability to pass through cost increases to ratepayers. Nonetheless, this is a sector where inflation protection is explicit, embedded in regulatory frameworks, concession agreements or long‑term contracts.

Infrastructure assets have clear pass-through mechanisms for inflation
Source: Magellan, August 2026
These unique mechanics of an infrastructure business support the resilient income profile of GLI and its demonstrated lower volatility and lower downside capture than listed real estate. Of course, like any asset class, GLI is not without risks. Political risks, taxation and social licence are all key issues affecting the licence to operate and acceptable returns on infrastructure assets. However, given the breadth of most specialist GLI investors’ portfolios, these risks are diversifiable across a portfolio.
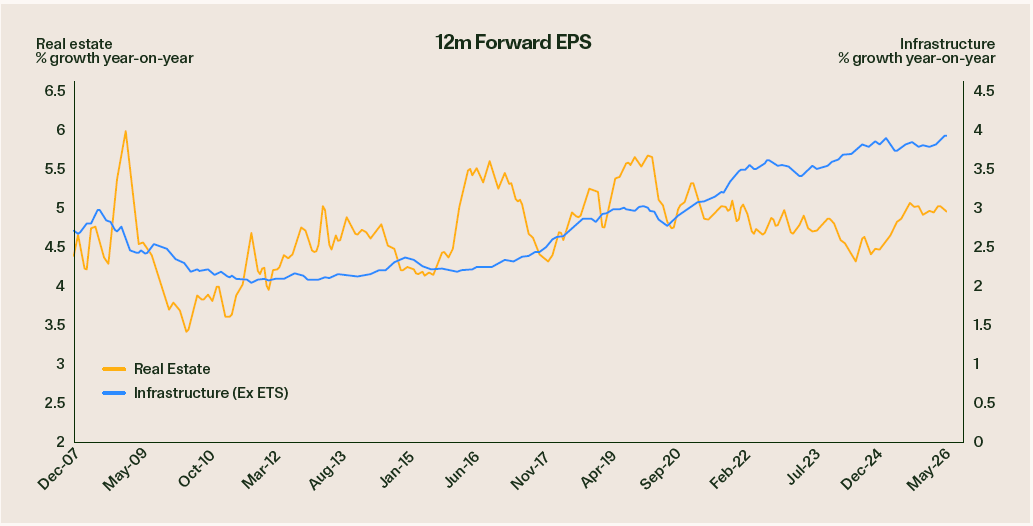
Property is not a monopolistic or regulated service. While listed property is also backed by long-duration assets, contractual agreements are typically shorter, and demand and pricing are more pro-cyclical. Earnings in this sector have demonstrated sensitivity to rising prices and interest rates, which are linked to tenant demand and real estate valuation conditions (with weaker economic activity or rising unemployment typically associated with higher vacancy rates and less attractive valuations) and financing costs. Sector-specific trends, including demand for office (for example, with the shift to work from home a marked headwind) and retail real estate (reflecting online shopping growth and consumer spending headwinds), also have impacts. As a result, demand and earnings can be cyclical instead of reliable. Historical EPS estimates for listed real estate highlight the cyclical nature of earnings for these businesses versus the more stable, defensive infrastructure earnings.

Listed real estate earnings have historically been cyclical
Source: GLIO, August 2026
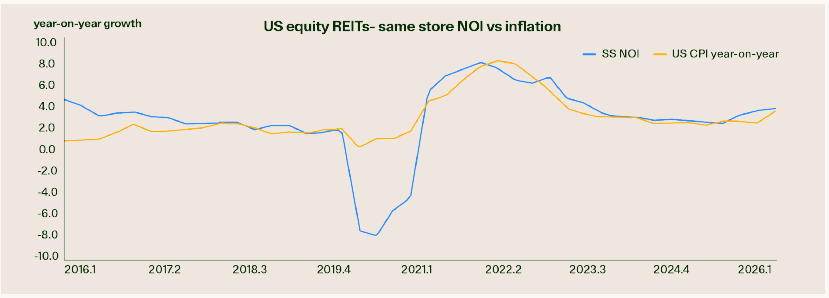
Listed property typically has fewer levers to use to pass through higher inflation and debt financing costs. The embedded inflation hedges available to real estate assets, in the form of lease indexation and rent escalations, are not a perfect cover for rising price pressures. In economic cycles that are driven by the supply side, such as the 2026 energy shock, this is even more the case, as demand is not the driver of higher prices. For example, US equity real estate investment trusts posted same-store net operating income (NOI) growth of 4.1% year-on-year in 2Q264, which compares to an average consumer inflation rate of 3.8% year-on-year for the quarter. Historically, there are many examples where NOI growth is just apace, or below, inflation.
Equity REITs same-store net income growth vs US inflation
Source: NAREIT, August 2026
Elevated inflation and the prospect of higher interest rates suggest higher financing costs, which can put pressure on cash flow to investors and on dividend growth. In fact, dividends per share paid by US REITs in the June quarter of 2026 fell -4.7% year-on-year, following a -1.6% year-on-year decline in the March quarter. This compares to an average quarterly growth rate of +4.7% year-on-year in the “cheap money” era from 2011-2022, and an average quarterly growth rate of 2% year-on-year from 2023-2025.
The strong structural case for listed infrastructure over the longer term
Investors in GLI and listed property are ultimately looking for not only dependable cash flow, but also structural growth over time. There are several factors to consider that influence the durability of returns for listed infrastructure and real estate in the coming years.
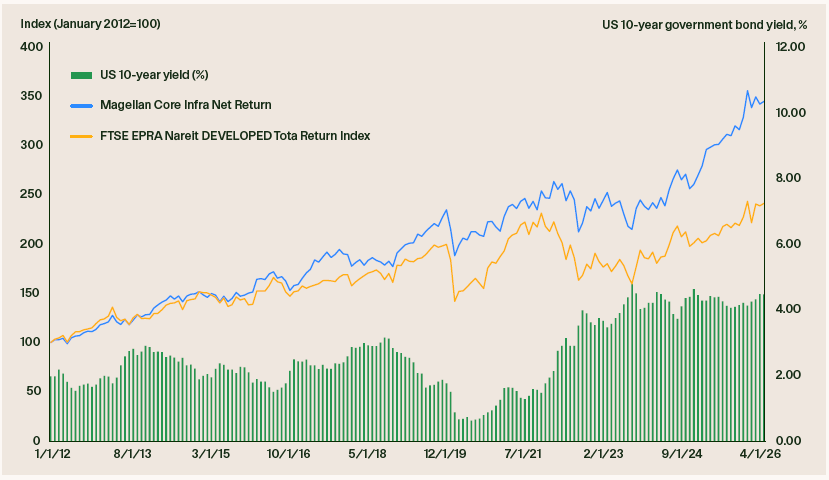
First, interest rates. Both GLI and listed property are relatively long-duration and benefited from the benign rate environment in the 2010s. Since the global financial crisis, low interest rates had been the predominant setting, which has been positive for valuations and share price performance. The Ukraine crisis in 2022/2023, which amplified covid-era supply chain issues, was a clear break with steep rate hikes in many markets. In this instance, listed real estate has appeared relatively more affected by rising rates than infrastructure. Higher borrowing costs and rising pressure on property values weighed on real estate companies. Structural changes in major economies, including the prevalence of work-from-home with Covid-19, which has persisted, are also important drags on commercial property demand. Listed infrastructure, while impacted, fared relatively well, supported by inflation-linked cash flows and dependable demand.
Listed infrastructure and real estate performance compared to benchmark bond yields
Source: GLIO, US Federal Reserve, Magellan, August 2026
Looking ahead, it appears unlikely that we will return to the era of cheap capital that developed the market experience for over a decade after the GFC. As long as the 2026 energy shock and its after-effects persist, inflation can be expected to remain elevated for longer. We expect interest rates are likely to settle at a structurally higher level in the coming years. Large government deficits and persistent inflation for longer means higher bond yields and borrowing costs are expected to remain the norm.
For real estate, this is potentially a structural headwind for returns. Higher borrowing costs are reflected in weaker prices for commercial property, as we have seen in the US in recent quarters. Higher rates in turn are a headwind for income-generating REITs.
Higher borrowing costs are a headwind for property prices and listed real estate performance
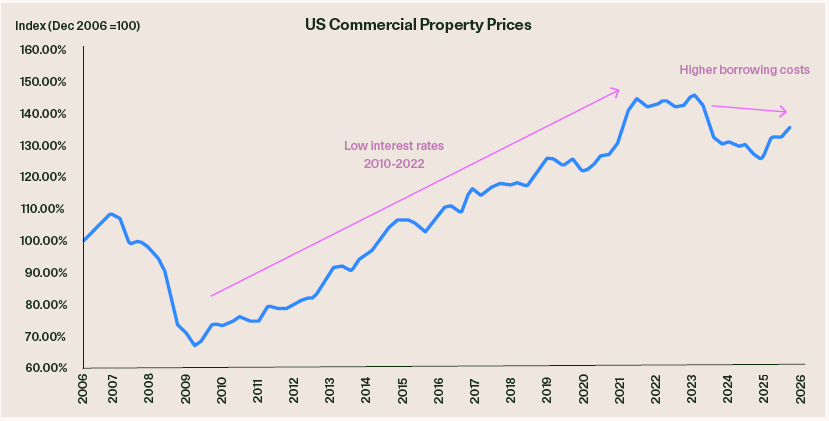
Source: US Federal Reserve, Magellan analysis, August 2026
Turning to infrastructure, this asset class can be expected to perform solidly in a range of scenarios for the economy and interest rates. Lower benchmark bond yields are positive for infrastructure companies, given the long duration of these assets. In times of economic downturn, the essential nature of the services these assets provide supports demand. However, in a scenario where inflation and interest rates remain higher for longer, the impact on infrastructure’s performance can be expected to be negative, but manageable. Higher real interest rates are the ultimate outcome of persistent inflationary pressures, which is a headwind for valuation. So long as real interest rates do not accelerate rapidly, the underlying performance of these businesses should not be materially affected, with the actual sensitivity of the asset class to higher borrowing costs contained. Further, the inflation pass-throughs available for these assets, which allow earnings to recover rising costs over time, provide an inflation hedge.
The second key driver is the structural trends affecting both listed infrastructure and listed real estate. Listed infrastructure is supported by some important structural shifts, including AI-driven power demand, which is feeding into unprecedented capex across regulated power utilities. Given these businesses earn an agreed return on their capital investment completed, this is a key lever for robust earnings growth into the future. Other regulated utilities are also undertaking large-scale capital investment, including the UK water utilities (following decades of under-investment), which provides a similar, long-term driver for earnings growth. Looking at other sub-sectors, airports and toll roads are also set to benefit longer term from strong demand, reflecting population growth and consumer preferences. These are powerful themes and suggest durable support for GLI.
For real estate, the structural trends are mixed. Changing demand and supply dynamics (including work-from-home impacts on office, changing residential markets reflecting affordability and the changing nature of retail) suggest some sector-specific risks ahead across real estate. While some sub-sectors are firm at present, including industrial, which is supported by the data centre boom, the outlook for demand is difficult to predict. As a result, there is limited visibility on the future supply/demand dynamics in real estate and also on earnings, particularly when compared to GLI.

Listed infrastructure is a core real asset allocation for investors
If the market conditions of 2026 have reminded investors of anything, it is an enduring truth: diversification is important in an investor’s portfolio. Volatile market conditions shine a light on the key role of real assets, as structurally different investments from general equities and bonds. Real assets are strategically important to investors when facing a macro and market environment that could be characterised by higher inflation, higher rates and more volatility.
GLI, which has historically earned equity-like returns while recording less downside capture, is an important asset class to fulfil a core allocation to real assets in an investor’s portfolio. The essential nature of the services these assets provide, along with inflation-linked cash flows and the potential for structural growth, indicate an attractive risk and return profile, particularly for longer-term allocations.
Listed real estate, which has historically been the “go to” for real asset exposure with its lower beta and income, also faces more cyclical exposure. As a result, GLI and listed real estate do not play directly interchangeable roles in a portfolio. While there can be room for both in a diversified portfolio, we see a different proposition in GLI as compared to listed real estate and other real assets and, in our view, an allocation to each asset class should be considered separately.
By The Magellan Infrastructure Team
1 Analysis for the period since the inception of the MFG Core Infrastructure Strategy, January 2012, to June 2026.
2 Standard deviation in USD total returns for the period January 2012 to June 2026. Listed infrastructure is the MFG Core Infrastructure Strategy, net of fees and in USD. Listed real estate refers to the FTSE EPRA NAREIT REITs total return index in USD, and the GPR 250 REITs index, in USD.
3 USD total returns for the period from January 2012 to June 2026. Listed infrastructure is the MFG Core Infrastructure Strategy, net of fees and in USD. Listed real estate refers to the FTSE EPRA NAREIT REITs total return index in USD, and the GPR 250 REITs index, in USD.
4 NAREIT August 2026. Data to 30 June 2026.
Important Information:
This material is not intended to constitute advertising or advice of any kind and you should not construe the contents of this material as legal, tax, investment or other advice. In making an investment decision, you should read and consider any relevant offer documentation applicable to any investment product or service and must rely on your own examination of the same and consider obtaining professional investment advice tailored to your specific circumstances before making any investment decision.
The investment program of the strategy or strategies presented herein ('Strategy') is speculative and may involve a high degree of risk. The Strategy is not intended as a complete investment program and is suitable only for sophisticated investors who can bear the risk of loss. The Strategy may lack diversification, which can increase the risk of loss to investors. The Strategy's performance may be volatile. Past performance is not necessarily indicative of future results and no person guarantees the future performance of the Strategy, the amount or timing of any return from it, that asset allocations will be met, that it will be able to implement its investment strategy or that its investment objectives will be achieved. Statements contained in this material that are not historical facts are based on current expectations, estimates, projections, opinions and beliefs and such statements involve known and unknown risks, uncertainties and other factors, and undue reliance should not be placed thereon. This material may contain ‘forward-looking statements’. Actual events or results or the actual performance of the Strategy or any financial product or service may differ materially from those reflected or contemplated in such forward-looking statements. The Strategy will have limited liquidity, no secondary market for interests in the Strategy is expected to develop and there are restrictions on an investor's ability to withdraw and transfer interests in the Strategy. The management fees, incentive fees and allocation and other expenses of the Strategy will reduce trading profits, if any, or increase losses.
No representation or warranty is made with respect to the correctness, accuracy, reasonableness or completeness of any of the information contained in this material. This information is subject to change at any time and no person has any responsibility to update any of the information provided in this material. This material may include data, research and other information from third party sources. No guarantee is made that such information is accurate, complete or timely and no warranty is given regarding results obtained from its use. The issuer of this material and its related entities and affiliates will not be responsible or liable for any losses, whether direct, indirect or consequential, including loss of profits, damages, costs, claims or expenses, relating to or arising from your use or reliance upon any part of the information contained in this material including trading losses, loss of opportunity or incidental or punitive damages.
This material and the information contained within it may not be reproduced, or disclosed, in whole or in part in any circumstances. , Further information regarding any benchmark referred to herein can be found at www.magellaninvestmentpartners.com/funds/benchmark-information/. Any third-party trademarks contained herein are the property of their respective owners and are used for information purposes and only to identify the company names or brands of their respective owners. (060126-#i1)
United Kingdom: This material has been prepared by Magellan Asset Management Limited (ABN 31 120 593 946 AFSL 304 301) doing business as Magellan Investment Partners and is distributed in the United Kingdom by Magellan Investment Partners (UK) Limited (FRN: 1037936), an appointed representative of Sentinel Regulatory Services Ltd (FRN: 1007093) which is authorised and regulated by the Financial Conduct Authority. This material does not constitute an offer or inducement to engage in an investment activity under the provisions of the Financial Services and Markets Act 2000 (FSMA). This material does not form part of any offer or invitation to purchase, sell or subscribe for, or any solicitation of any such offer to purchase, sell or subscribe for, any shares, units or other type of investment product or service. This material or any part of it, or the fact of its distribution, is for background purposes only. This material has not been approved by a person authorised under the FSMA and its distribution in the United Kingdom and is only being made to persons in circumstances that will not constitute a financial promotion for the purposes of section 21 of the FSMA as a result of an exemption contained in the Financial Services and Markets Act 2000 (Financial Promotion) Order 2005 (FPO) as set out below. This material is exempt from the restrictions in the FSMA as it is to be strictly communicated only to 'investment professionals' as defined in Article 19(5) of the FPO.
United States: This material has been prepared by Magellan Asset Management Limited (ABN 31 120 593 946 AFSL 304 301) doing business as Magellan Investment Partners (‘Magellan’) which is a registered investment adviser. The investment strategies described herein are offered in the United States by Magellan Investment Partners North America, Inc., a U.S.-registered investment adviser. Magellan and Magellan Investment Partners North America, Inc. are affiliated entities for purposes of the Investment Advisers Act of 1940. Registration as an investment adviser does not imply any level of skill or training. This material is not intended as an offer or solicitation for the purchase or sale of any securities, financial instrument or product or to provide financial services. It is not the intention of Magellan to create legal relations on the basis of information provided herein. Past performance does not guarantee future results. Where performance figures are shown net of fees charged to clients, the performance has been reduced by the amount of the highest fee charged to any client employing that particular strategy during the period under consideration. Actual fees may vary depending on, among other things, the applicable fee schedule and portfolio size. Fees are available upon request and also may be found in Part 2 of Magellan’s Form ADV.
Canada: This material is provided to you by Magellan Asset Management Limited (ABN 31 120 593 946 AFSL 304 301) doing business as Magellan Investment Partners (‘Magellan’). Magellan is not registered in any province in Canada. The head office of Magellan is in Sydney, Australia and all or substantially all of its assets are situated outside of Canada. Due to the foregoing, there may be difficulty enforcing legal rights against Magellan.
South Africa: This material is provided to you by Magellan Asset Management Limited (ABN 31 120 593 946 AFSL 304 301) doing business as Magellan Investment Partners, who in accordance with FAIS Notice 55 of 2023 issued by the Financial Sector Conduct Authority, Magellan Investment Partners is exempted from section 7(1) of the Financial Advisory and Intermediary Services Act, 2002 (Act No. 37 of 2002). This material is not an offer in terms of Chapter 4 of the Companies Act, 2008.
UAE: This material has been produced by Magellan Asset Management Limited (ABN 31 120 593 946 AFSL 304 301) doing business as Magellan Investment Partners. This material is not for distribution to any other person. This material, and the information contained herein, does not constitute, and is not intended to constitute, a public offer of securities in the United Arab Emirates (‘UAE’) and accordingly should not be construed as such. Any offer of securities or financial services is made only to a limited number of exempt Professional Investors in the UAE who fall under one of the following categories: federal or local governments, government institutions and agencies, or companies wholly owned by any of them. No securities or services have been approved by or licensed or registered with the UAE Central Bank, the Securities and Commodities Authority, the Dubai Financial Services Authority, the Financial Services Regulatory Authority or any other relevant licensing authorities or governmental agencies in the UAE (the ‘Authorities’). The Authorities assume no liability for any investment that the named addressee makes as a Professional Investor. This material is for the use of the named addressee only and should not be given or shown to any other person (other than employees, agents or consultants in connection with the addressee’s consideration thereof).
Japan: This material is prepared by Magellan Asset Management Limited (ABN 31 120 593 946 AFSL 304 301) doing business as Magellan Investment Partners. The content is for informational purposes only and directed at Qualified Institutional Investors and other professional investors as defined in the Financial Instruments and Exchange Act. No distribution of this material will be made in any jurisdiction where such distribution is not authorised or is unlawful. This material does not constitute, and may not be used for the purpose of, an offer or solicitation in any jurisdiction or in any circumstances in which such an offer or solicitation is unlawful or not authorized or in which the person making such offer or solicitation is not qualified to do so.
Other jurisdictions: This material is provided to you by Magellan Asset Management Limited (ABN 31 120 593 946 AFSL 304 301) doing business as Magellan Investment Partners. No distribution of this material will be made in any jurisdiction where such distribution is not authorised or is unlawful. This material does not constitute, and may not be used for the purpose of, an offer or solicitation in any jurisdiction or in any circumstances in which such an offer or solicitation is unlawful or not authorized or in which the person making such offer or solicitation is not qualified to do so.